Welcome to Sharelytics! This is your guide to unlock the power of the most comprehensive carsharing & car rental data. Sharelytics features over twenty-five metrics, such as the number of rentals, listing growth, and utilization. Listing-level and aggregate information is available by city. The metrics are organized in a page fashion (pages are navigable on the left side of the app), and are updated on a daily, weekly or monthly basis:
- Forward-looking demand data, on the Seasonality Page, are updated daily
- Listing data is pinged weekly
- Key performance indicators, such as Average Daily Rate (ADR), Booking (utilization) Rates, and Revenue, are displayed in the app for the last full calendar month and are updated monthly
This guide is Part 1 of a 2-Part series of posts. Part 2 will be posted in the near future.
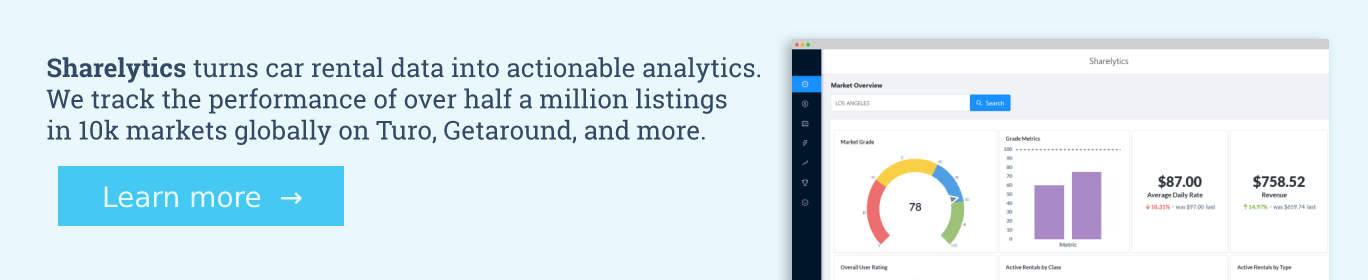
Sharelytics data is available via paid subscription, however, there are many valuable charts in the Market Overview Page that are freely available to anyone who creates an account. Users are welcome to explore over 500,000 listings in over 10,000 markets worldwide within Sharelytics.
Market Grades — A Global Perspective of Your Market
Every city is given a Market Grade from A to D to indicate the current performance of that car rental market as compared to the biggest 2,000 markets around the world. The grade is calculated by looking at two different metrics: rental demand and revenue growth. Here’s a quick look at the logic for each metric:
Rental Demand
How often have car rentals been booked over the course of the last year?
We combine the last twelve months of bookings with listing growth rates to make sure that while the market is growing, cars are still achieving high booking rates.
Revenue Growth
Are cars making more money this month than they did in the same month last year?
We isolate cars that have been listed on Turo and/or Getaround at least six months and see if on average they made more this year than they did last year.
Reading Smart Number Cards
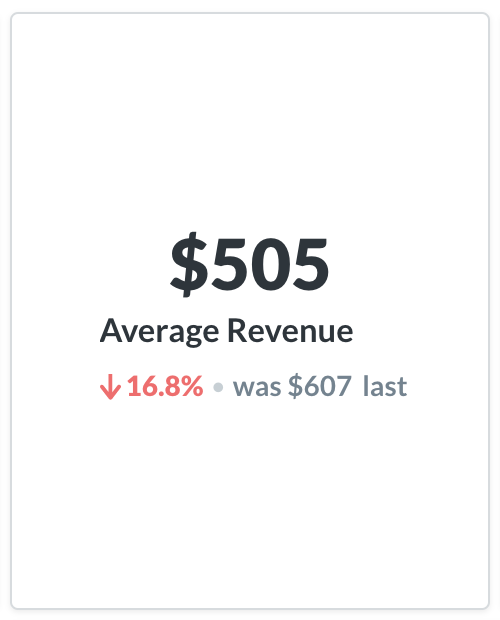
Above we see an example of a Smart Number card. These cards are used across various pages to highlight key performance indicators. In the case above, we see the Average Revenue: $505 indicates the average revenue for the market last month. $607 is the average revenue for the month previous to the last month. 16.8% indicates there was a relative percentage decline over the 2 month period.
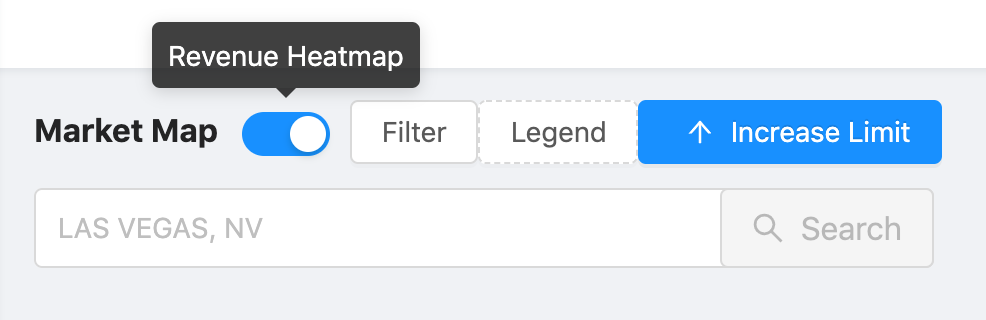
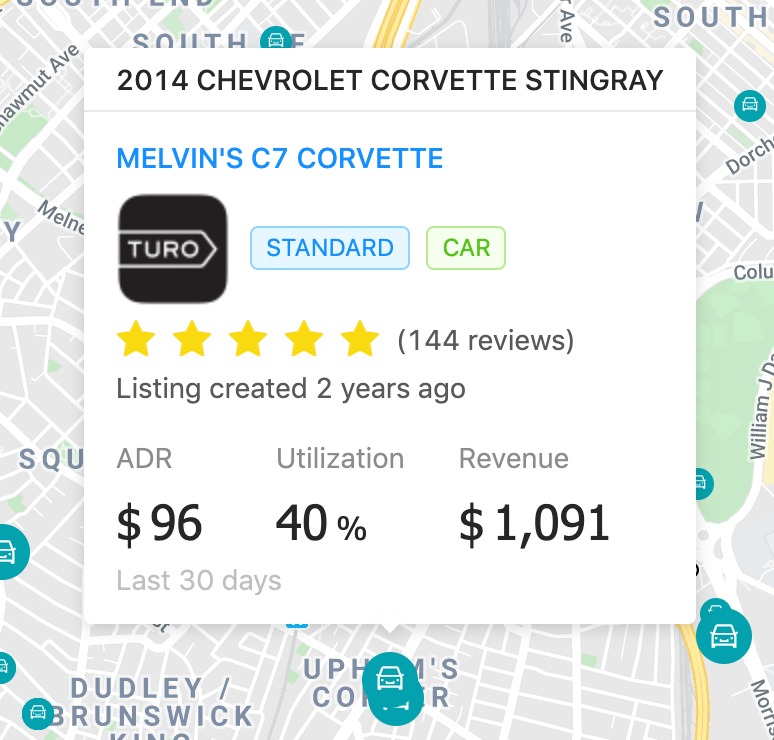
Navigating the map
The Market Map page makes the ideal place to navigate the area and look at comparable cars. Use the icons in the top of the map to filter cars by class: super deluxe, deluxe or standard, and isolate your relevant comparables. Click the vehicle title to view the listing directly on Turo or Getaround.
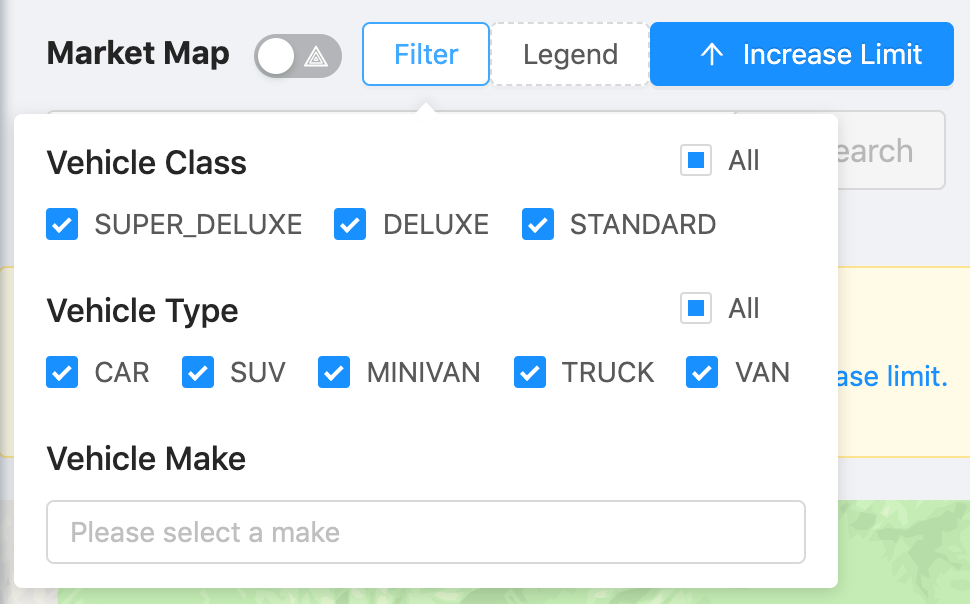
If you operate in a large market with thousands of rentals, make sure to subscribe to the Pro plan to view all data. We limit the number of results on the map to 1000 to make the app load quicker.
The icons in the map are dynamically sized based on the Average Daily Rate (ADR) for the listing in the last 30 days. When you use the map filters, visible icons will auto adjust on the map. Additionally, helpful icons let you know whether each rental is listed on Turo, Getaround, or both. The Market Map is great for easily identifying the highest performing rentals of any size based on location.
Implementing a Competitive Pricing Strategy
Effective pricing is the single biggest challenge facing hosts and mobility providers today. The sheer quantity of rental cars, the ebb and flow of travel demand, and the shortening booking window have left even the most seasoned pros scratching their heads.
In this section, you’ll learn the in’s and out’s of how to use the Sharelytics to make smarter pricing decisions.
Forward-looking trends
One of Sharelytics' most influential aspects is the ability to see future demand for a market. Because no two months or seasons look exactly the same, being able to see future booking activity can help hosts and fleet managers spot and intercept risks and opportunities with enough time to adjust pricing and beat out competition.
Heads up: We'll be posting a deep-dive in the near future about using forward-looking data to optimize pricing.
Here are two scenarios to watch out for, regarding forward-looking data:
Booked rate is lower than the available rate
Sometimes, the rate at which people are actually booking skews lower than the rate all remaining available rentals are advertising. This is normal. However, if the gap begins widening as the date draws nearer, it’s a signal to lower your rate, or risk not being booked for the date.
However, if the gap begins widening as the date draws nearer, it’s a signal to lower your rate, or risk not being booked for the date.
High demand holidays, like the July the 4th, usually see an increase in supply from first-time hosts who are looking to cash-in on the event. A few days before an event, the median available rate was $117 while the median booked rate was $90. Had the novice hosts known this, they could have lowered their rates and made atleast $90. Instead, many made $0.
Demand score is increasing ahead of a specific date
The calendars on the Seasonality page are updated on a daily basis, which allow users to monitor changes in demand as future dates approach. If you notice specific days in the future turning to shades of green (indicating increasing demand), it’s a sign that you can begin increasing your rate without decreasing your chances of getting booked.
Historical trends in Average Daily Rate (ADR)
The carsharing market has been growing at a rapid pace, as an increasing number of new and eager hosts are looking to make a side income.
The sudden addition of often hundreds of new rentals has left many hosts scratching their heads, wondering if their past pricing strategies are still effective in this new, volatile environment. One of the first questions fleet managers often ask is: “What effect has more car rentals had on my ability to price?”
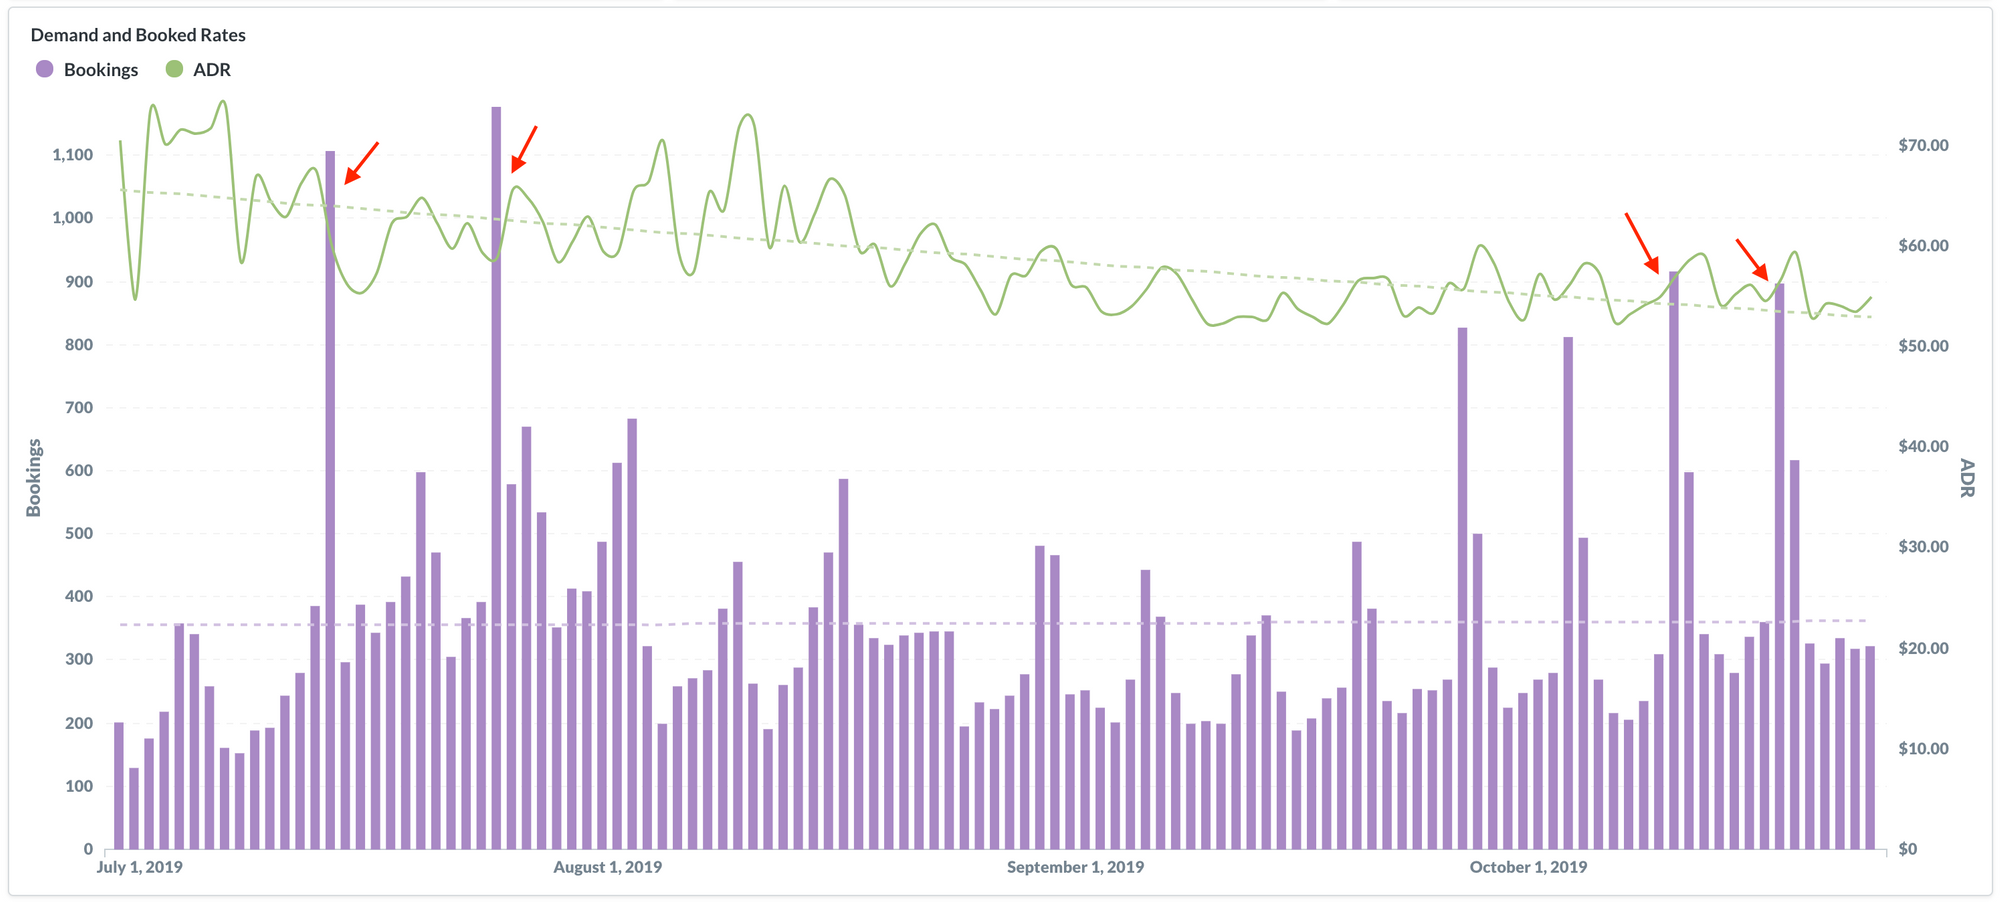
We attempt to answer the basics of this supply and demand conundrum in the Average Daily Rate (ADR) chart. By overlaying the number of booked cars (supply) with ADR (demand) there are three conclusions that can be made.
Demand is outpacing supply
This is the best case scenario. While there are more listings than a year ago, ADR is still on the rise. You can see an example of this in the graph above. The red arrows point to sudden surges in demand. Reading from the left, the first surge is an example of hosts failing to react to the surge and prices did not increase the next day. The second arrow is better but not quick enough. The last two arrows are great examples of hosts reacting to sudden demand spikes and increasing their prices.
Supply and demand equilibrium
In this case, ADR is remaining relatively flat year over year, and the delicate dance of demand and supply are moving harmoniously over time.
Supply is outpacing demand
A surge in car rentals is having a material impact on the ability of hosts to charge the same rates they have historically. If this is the case, it is more important than ever to develop a proper pricing and marketing strategy.
Painting the complete pricing picture
ADR is the average daily rate that a vehicle is being booked for (excluding fees). While the average is a good enough metric for the traditional car rental industry, carsharing is extremely diverse in quality and pricing sophistication so a more comprehensive picture is needed to understand what is driving the changes in the average daily rate.
The best visualization to dig deeper into the range of values that are driving the average daily rate is called a box and whisker chart. This chart displays an array of ADR quartiles that help you understand the distribution of trends over time. Watch this video to learn more about box and whisker charts.
Stay tuned for Part 2 of this 2-part series guide.
Our Commitment
We are committed to providing our customers with the most comprehensive carsharing and car rental data and the most actionable insights to optimize your pricing, find lucrative vehicles, and manage your listing portfolios.
As always if you have any questions or specific requests, the Sharelytics team is available to help. We try to have multiple sources of help: this blog, the knowledgebase, live chat and email support.