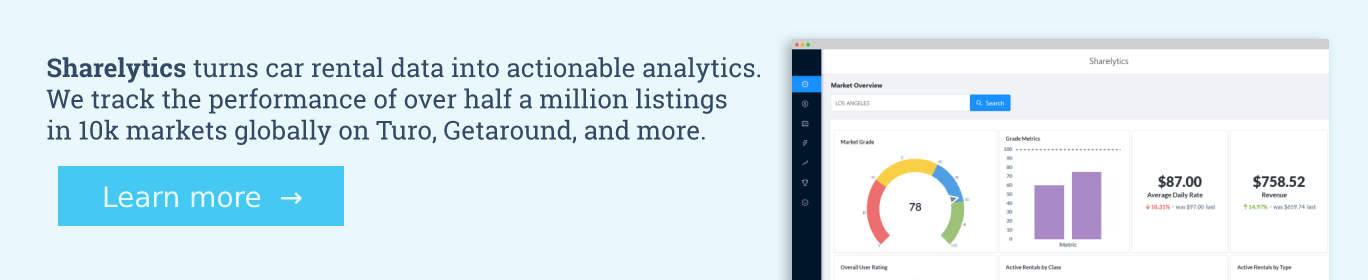
Welcome to Part 2 of the Sharelytics guide to unlocking the power of the most comprehensive carsharing & car rental data. Be sure to read Part 1 first.
Booking Rates and Utilization
Everyone fears a rental sitting idle for extended periods of time. Getting as many bookings as possible is the name of the game and Booking Rate (aka Utilization Rate) is the best gauge for projecting the % of days that a rental will be booked.
Booking Rate = Booked Days / Available Days
Although booking rates are important, in isolation it can be a very misleading metric. Many Turo hosts will say, “My rental is doing amazing! It’s almost 100% booked for the next 3 months.” While that is great if you are hosting as a hobby, it’s horrible news if you are running a business. Being more than 50% booked 3 months in advance almost always indicates your rates are too low.
Being more than 50% booked 3 months in advance almost always indicates your rates are too low.
In most cities, there is a large variance between the best and average cars. This can mostly be attributed to how aggressively the cars are being priced.
Finding the right balance between price and occupancy- this is perhaps the biggest challenge and will require a certain amount of trial of error to perfect for each listings. But, Sharelytics provides some great data points to give you a head start.
What now? How this information influences your booking strategy
Every rental car and location is unique, making specific recommendations difficult. But below are a few examples of data-driven strategies used by some of the best and brightest hosts.
Lengthy Trip Discounts
No matter how bad a season may be, there are always a few people looking for a longer trip. During low season, hosts should set a one-week minimum duration and try to fill as many Sunday to Thursday as possible by offering a large 40%+ weekly discount. Try setting a bargain daily rate for a monthly minimum trip three months in advance, and if nothing materializes, moving to a week minimum trip. Continue to reduce your minimum trip requirement as the dates approach.
Extending Stays
Another option for achieving higher booking rates in the slow season is enticing guests to extend their trip by a day or two. This can be accomplished by reducing rates on Thursdays and Sundays by a significant amount. Many people make the mistake of changing their minimum trip duration to try to achieve this. But this can backfire, as you’ll be removed from the search results for all weekend searches. A better approach is to dramatically drop rates on dates around peak dates. For example, if your rate is $300 for Friday and Saturday, drop Sunday and Thursday to $99 and set your settings to only allow 3 day trips when those dates are included.
The Hold Out
On the opposite side of the spectrum is understanding how to maximize the booking value for high demand dates. When revenue per available vehicle spikes by 400%, your approach should be completely different – as a host, you become the suited not the suitor. You know the inquiries will be flooding in and the bargain hunters are going to be knocking down your door. This strategy requires patience and a tolerance for risk. (Remember, if you are reading this, you are more informed than 95% of car rental operators.) Set your prices extremely high and let others start to take bookings. Use the Demand and Booked rates chart in the Pricing page to see how the going rate and demand are materializing. The goal here is to catch a booking in the last week or two from someone with lots of money and few options.
Revenue — Prospecting and Benchmarking
All the topics we’ve covered up to this point are building blocks of the single most important metric – revenue. Whether you are looking to increase your income on an existing rental or acquire new high performing rentals, the Market Revenue and My Vehicles sections are the places to go to benchmark current rental performance and forecast the earning potential of new investments.
Tip: Read this tutorial to learn how to use Sharelytics DealCheck feature to see how your rental stacks up. You can also use it for quick vehicle purchase analysis.
Let’s jump into exactly how Sharelytics calculates listing level revenue.
Revenue = Booked Rate (excluding cleaning fees) * Trip Length
Everyday, we ping all listings for a positive delta in trip count and for any new unique bookings. Our algorithm analyzes every new set of unavailable calendar days to determine whether the dates are a booking or blocked by the owner. If there are bookings found, we determine the value of each booking using the rates that were available the day before the booking was made.
How does Sharelytics determine what is a booking vs. a blocked day?
For Getaround data, we are able to fetch this directly from the listing's public calendar. It shows which dates are actual bookings.
For Turo data, we use 'signals' such as trip length, change in trip count, response rates and other indicators to assess likelihood each set of dates to be a booking. We supplement and update our algorithm continuously with real booking data around the world. While no model is perfect, we’ve tested ours to accurately identify 90% of bookings globally.
Reading the revenue charts
Before you read the revenue charts, a word about percentiles, averages and medians: Vehicles in the 50th percentile are doing the average revenue. If your vehicle is doing better than average that means its doing better than atleast 50% of the market. The median can sometimes be the same or close to the average and sometimes it can be very different. This is because the average can be skewed by very large or small values. Therefore, the median is a better measurement to use in revenue because it is always the middle point regardless of outliers.
One of the first questions one should ask on the Revenue page is: where am I on the revenue spectrum? Using the month's median revenue value you can answer that question. The answer to that question will also drive what you should do next. If you are in the 90th percentile- you're doing great and you don't have much work to do.
If you have some work to do, fear not! Because the graphs below will help you in your next actionable step: trimming the loss units and adding revenue-generating units. Figuring out what year, make, model works best for you is a market-dependent question- and it is exactly what Sharelytics answers.
Figuring out what vehicle year, make, model works best for you is a market-dependent question- and it is exactly what Sharelytics answers.
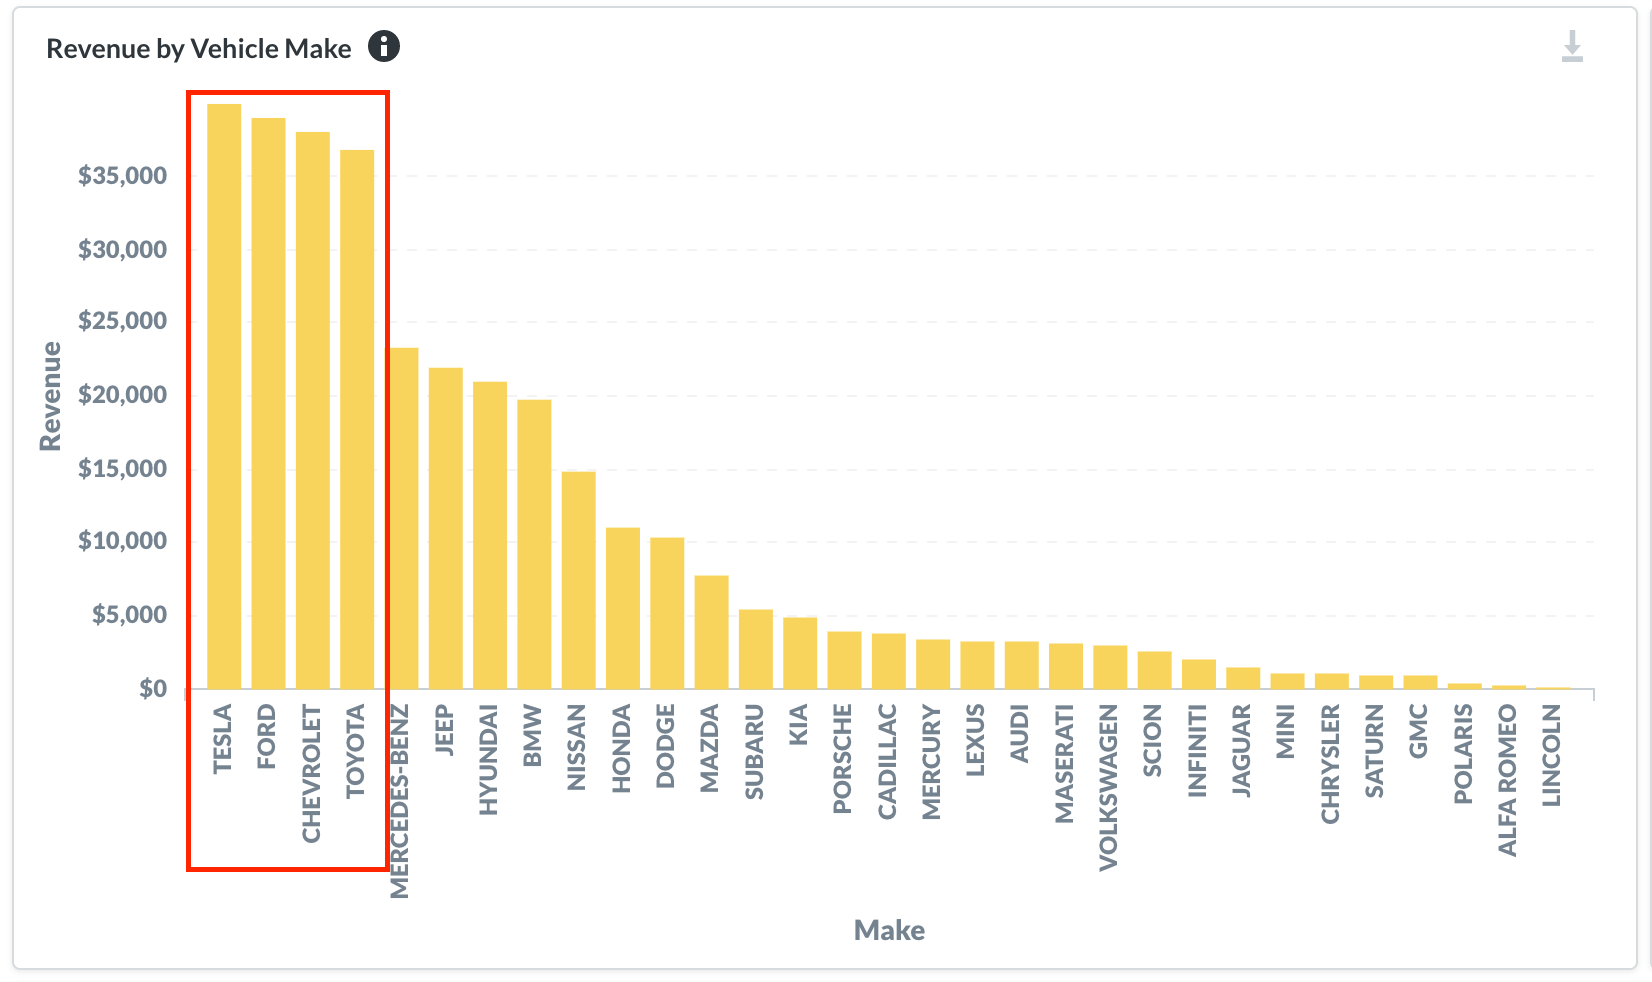
Below we can see the Revenue by Vehicle Make outlined with the top makes by revenue in the last 6 months. Vehicle Make: ✅ you can use similar graphs to drill down on the model and year.
Tip: Looking to snag even more income from your existing fleet? Read this post to learn how to use Sharelytics to pick the best Turo extras.
Historical market revenue
Here you can view the total estimated revenue generated by all Turo and Getaround listed vehicles. The Historic Market Revenue chart was created to show overall car rental growth.
Additional Guides & Support
As always if you have any questions or specific requests, the Sharelytics team is available to help. We try to have multiple sources of help: this blog, the knowledgebase, live chat and email support.